TS Analyzer
TS Analyzer is a compact, dedicated hardware platform for broadcast transport stream monitoring, analysis, and recording. Designed for use in the field and in the rack, it consolidates IP, ASI, and RF signal reception into a single device — eliminating the need for separate RF analyzers, protocol analyzers, and dedicated monitoring tools.
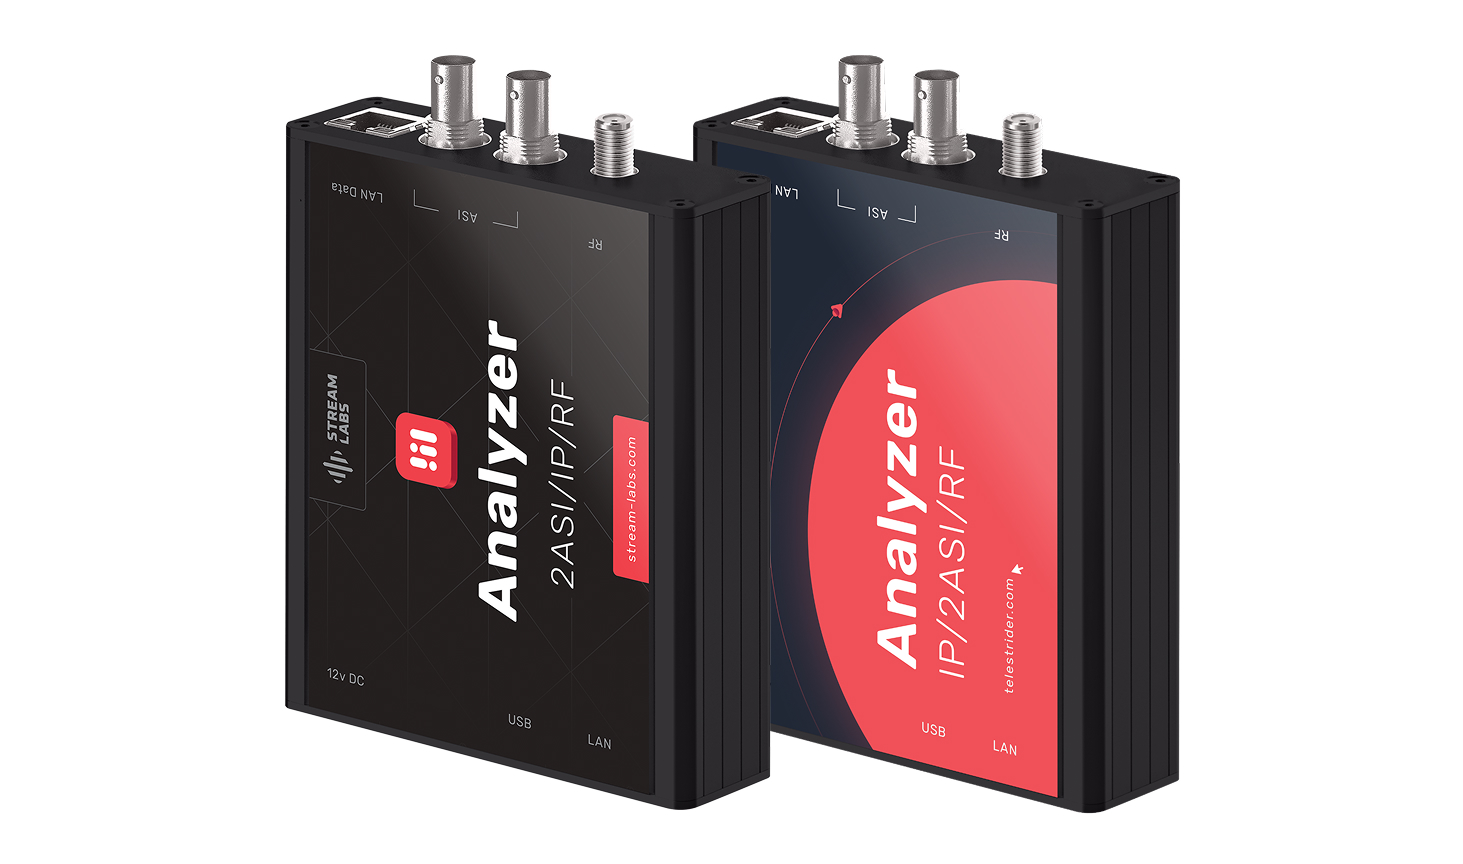 This device is also known as the Telestrider Analyzer; labels may vary. Stream Labs is OEM manufacture.
Key capabilities
Multi-input signal reception — IP (MPEG TS over UDP/RTP), dual ASI, and RF (DVB-T/T2, DVB-C) inputs in one compact enclosure.
Transport stream analysis — full ETSI TR 101 290 error monitoring across all three priority levels, PSI/SI table inspection, PCR/PTS/DTS jitter analysis, and bitrate histograms per PID and service.
IP network quality metrics — IPAT (inter-packet arrival time) jitter analysis, MDI (RFC 4445) delay factor and media loss rate, duplicate packet detection.
CAS and EPG monitoring — Simulcrypt-compatible conditional access diagnostics, EIT table validation, and electronic program guide content verification.
Remote access — web-based management interface accessible over the network; no client software required.
Alerting and logging — continuous error counters, event log with timestamps, and configurable error profiles to suppress known-benign conditions.
Typical use cases
- Verifying signal quality at headend outputs and distribution points
- Diagnosing CCE (continuity count errors) and tracing them to their source device
- Validating PSI/SI table structure and timing after multiplexer configuration changes
- Checking EPG and CAS stream integrity in conditional access deployments
- Field monitoring of DVB-T/T2 and DVB-C reception quality
Typical deployment environments
- Satellite, cable and terrestrial broadcasting headends
- Radio and television broadcasting stations
- Technological communication networks
- Video surveillance systems
- Communication network monitoring and control centres
Quick Start
1. Connect the device
Plug in power (12V, included adapter) and connect the management LAN port to your computer or network switch.
2. Configure your computer's network interface
Set your PC's Ethernet adapter to a static IP on the 172.16.112.x subnet (for example 172.16.112.2 / 255.255.255.0) to reach the device at its default address. See Installation for step-by-step instructions.
3. Open the web interface
Navigate to http://172.16.112.1 in a browser. Log in with the default credentials (admin / admin).
4. Change the default password
Go to Settings → Password and set a secure password before connecting the device to a shared network.
From there, configure the device's network settings for your environment — either static IP or DHCP — and connect your signal sources to the appropriate input ports.