Bitrates and Timestamps
Types of bitrate
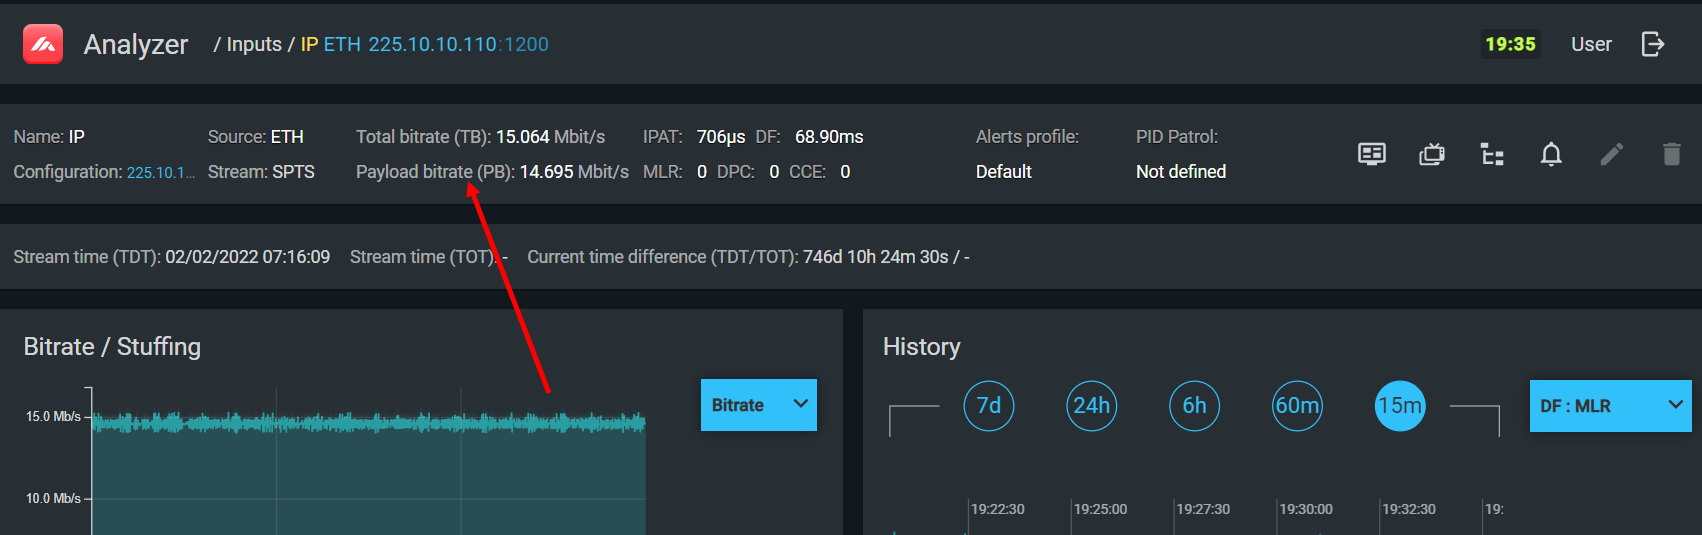
TS Analyzer measures and displays bitrate at several levels of granularity:
| Bitrate type | Description |
|---|---|
| Total bitrate | Full stream bitrate including stuffing (PID 8191). Usually constant. |
| Payload bitrate | Total bitrate minus stuffing. Usually variable, even in nominally CBR streams. |
| Service bitrate | Combined bitrate of all component PIDs for a single service. Constant in CBR services, variable in VBR or stat-mux. |
| PID bitrate | Bitrate of a single PID. |
Always verify measured bitrates against your multiplexing scheme. Unexpected values indicate either a configuration error or a malfunction in the device responsible for that PID or service.
Average vs. instantaneous bitrate
TS Analyzer measures average bitrate over a one-second window. Instantaneous bitrate — the bitrate over a very short interval — is not directly measured, but its behavior can be inferred from the bitrate timeline graph.
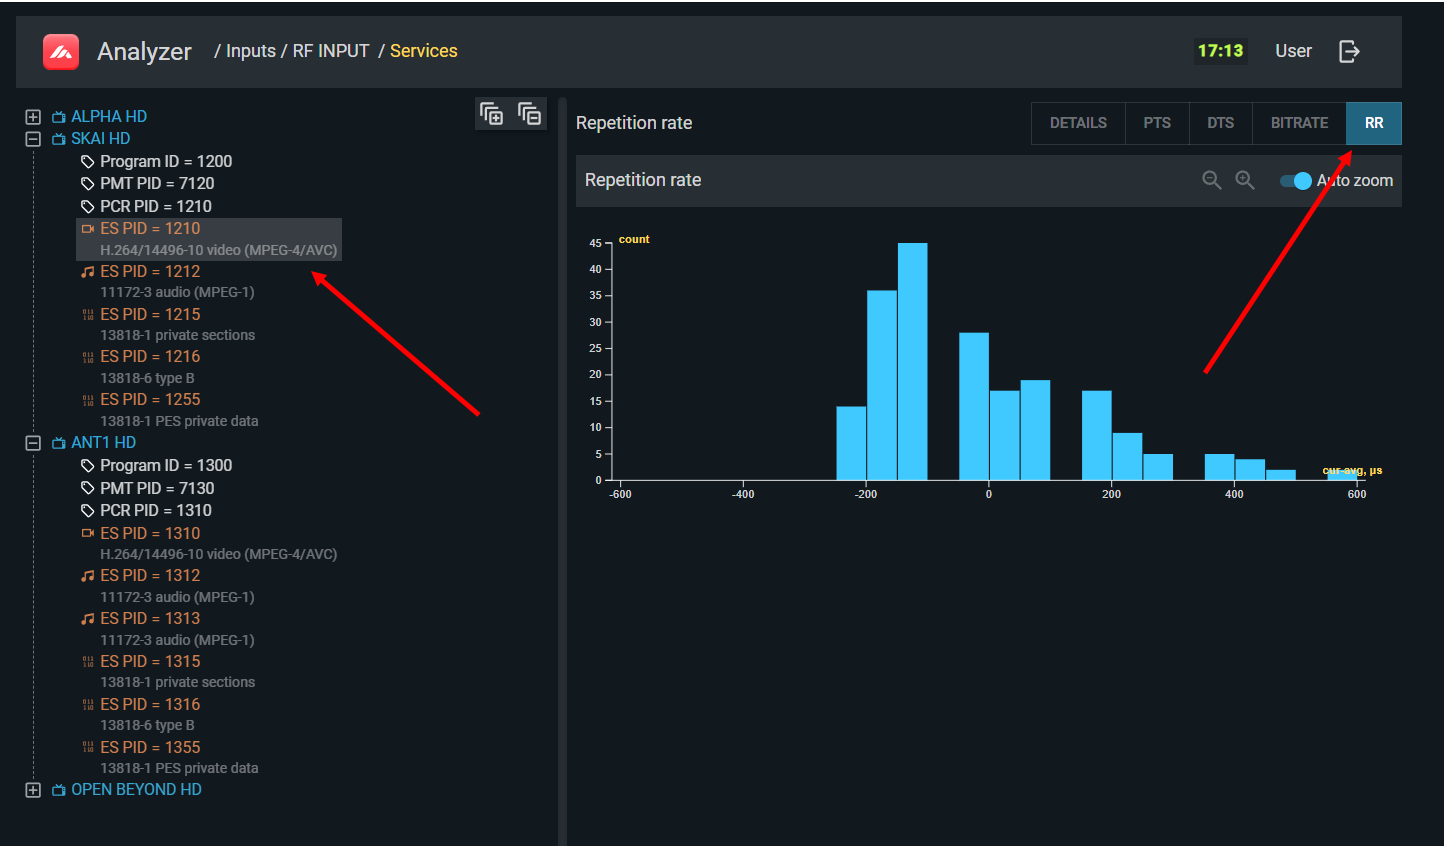
Individual PID bitrates with histograms:
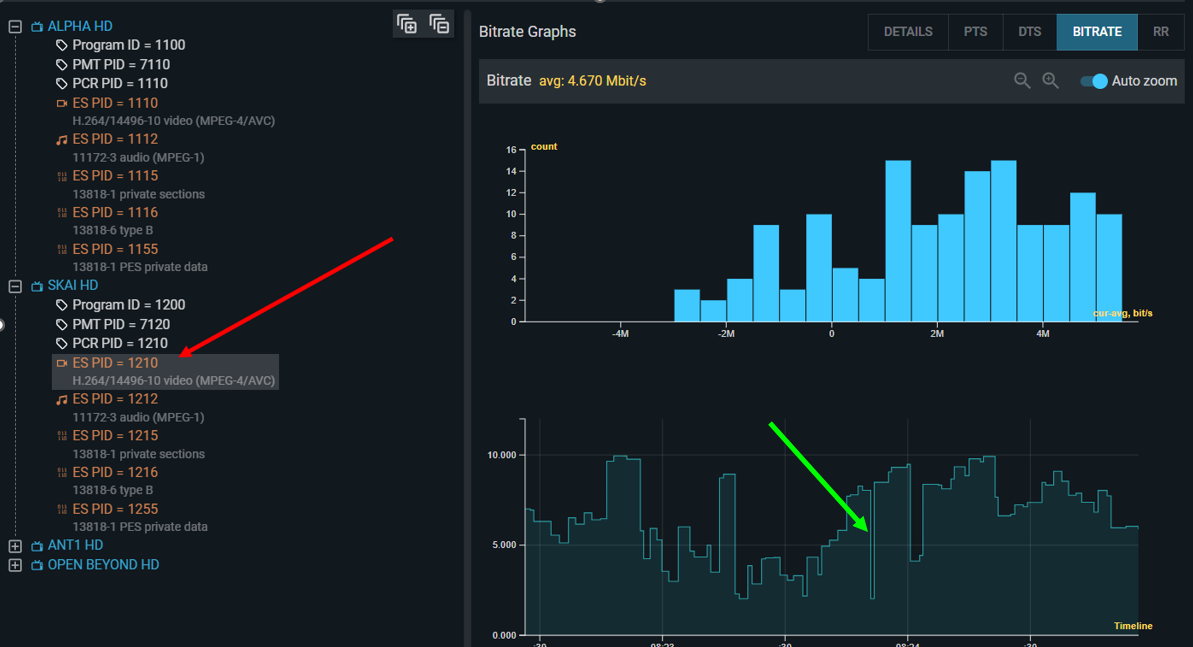
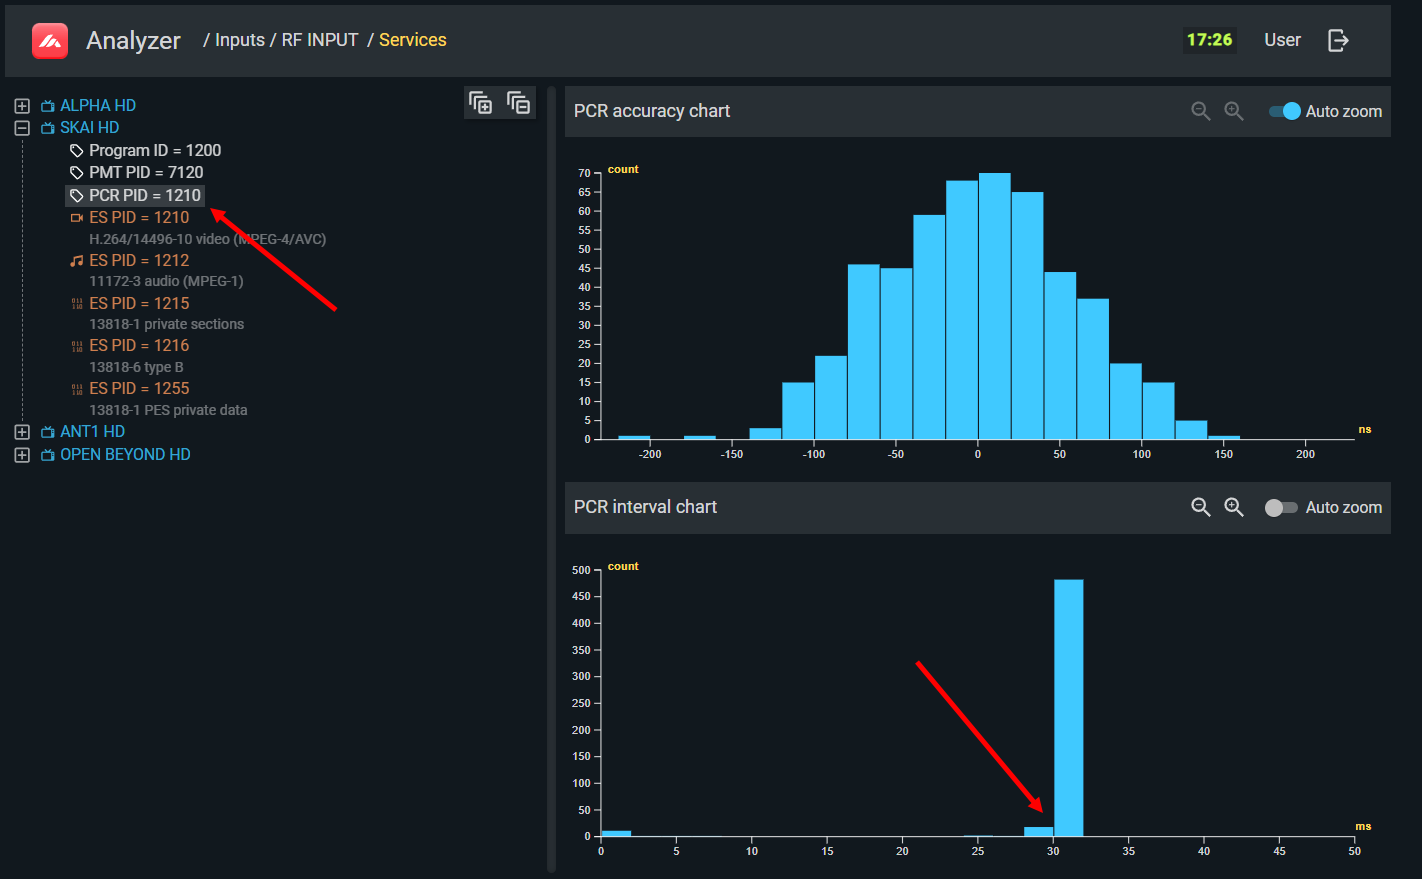
A spike in the timeline graph (a narrow peak) suggests a momentary burst in instantaneous bitrate. Such bursts can overflow the receiving device's buffer even when the average bitrate is within limits, causing CCE errors. Similarly, a sudden dip (trough) indicates a momentary drop, which can cause buffer underflow and the same CCE result.
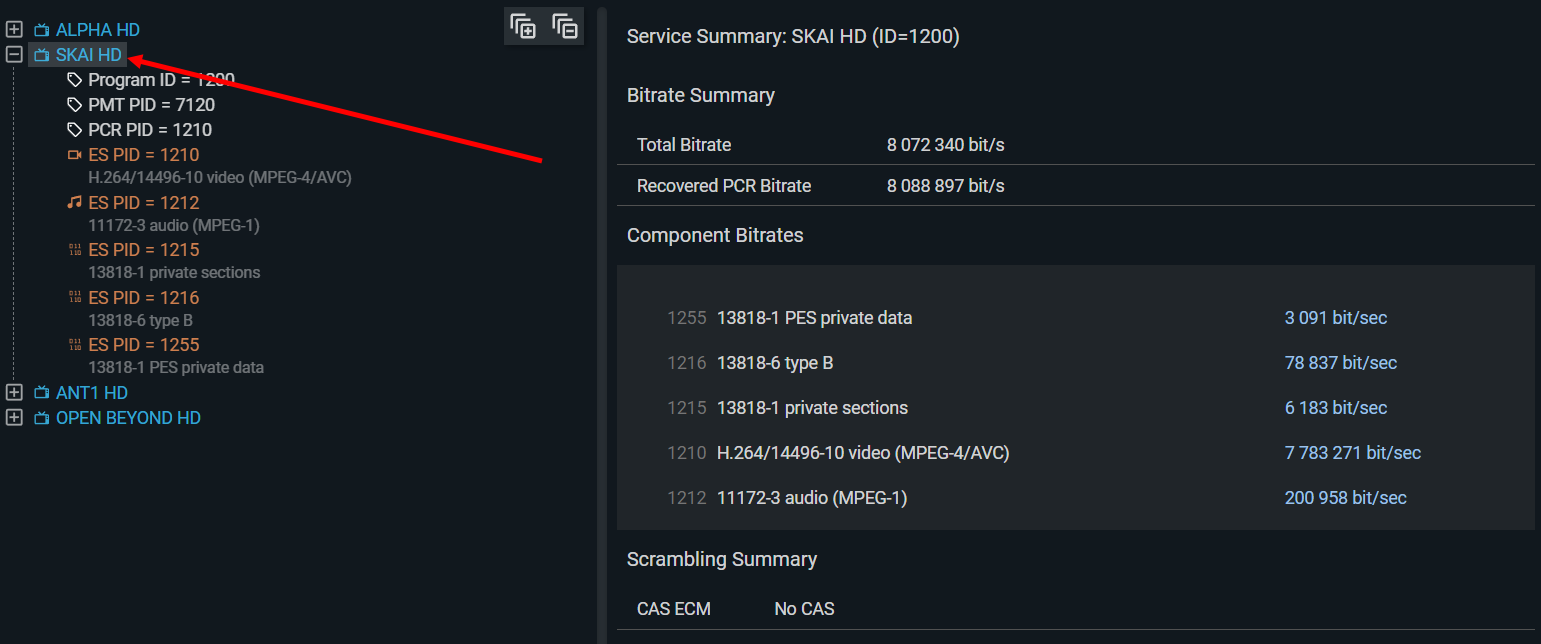
To view bitrate for all components of a service, click on the service name:
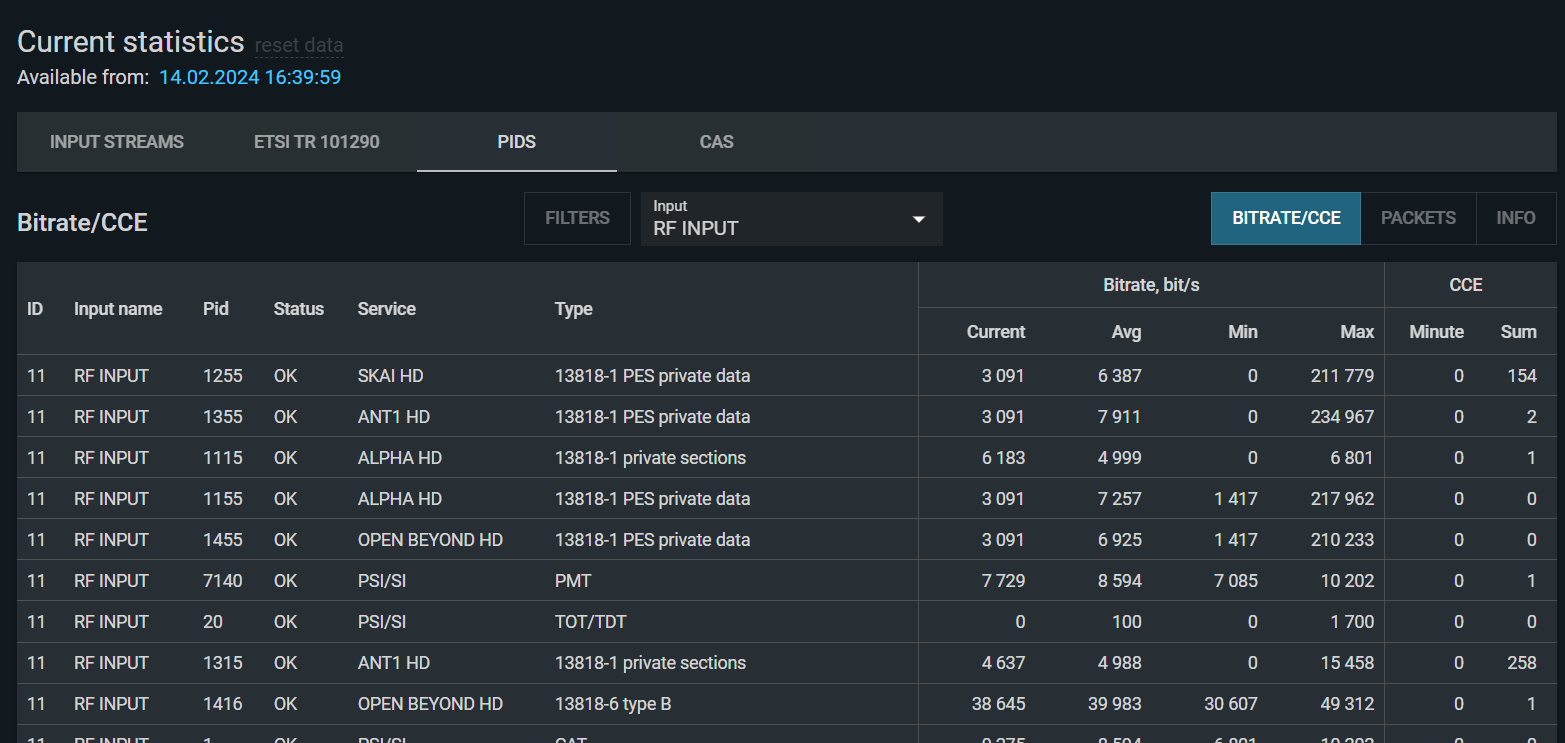
For an overview of multiple PIDs simultaneously with current, average, min, and max values, use the Current Statistics view:
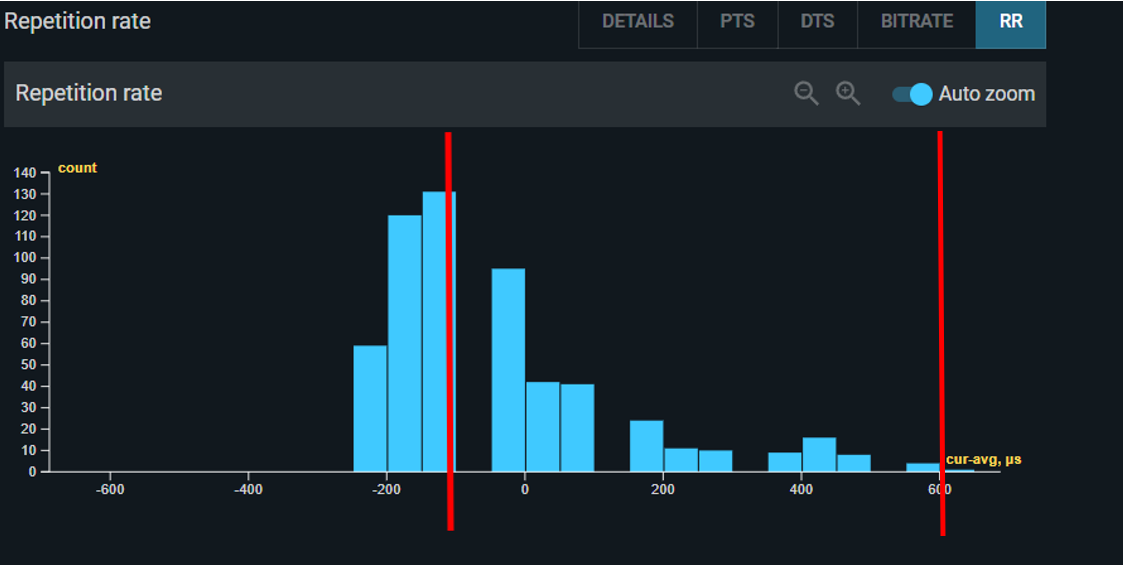
Histograms
TS Analyzer uses histograms to show the distribution of measured values over time, not just the current value. Understanding the shape of a histogram is essential for interpreting PCR and IPAT data.
- Single narrow bar — the value is essentially constant. For PCR deviation, this is ideal.
- Gaussian distribution ("bell curve") — small random deviations around a mean. Normal for network jitter and PCR deviation in a well-functioning CBR service.
- Multiple bars or chaotic distribution — the value is variable or irregular. For PCR deviation, this indicates a VBR service or a PCR generation problem.
- Long tail to one side — asymmetric deviation. Indicates a systematic bias (e.g., PCR transmitted more frequently than the configured interval).
PCR and service bitrate
PCR is a clock reference embedded in the TS that allows the decoder to synchronize with the encoder. The PCR histogram displays deviations of the actual PCR value from its expected value, calculated based on the measured constant bitrate.
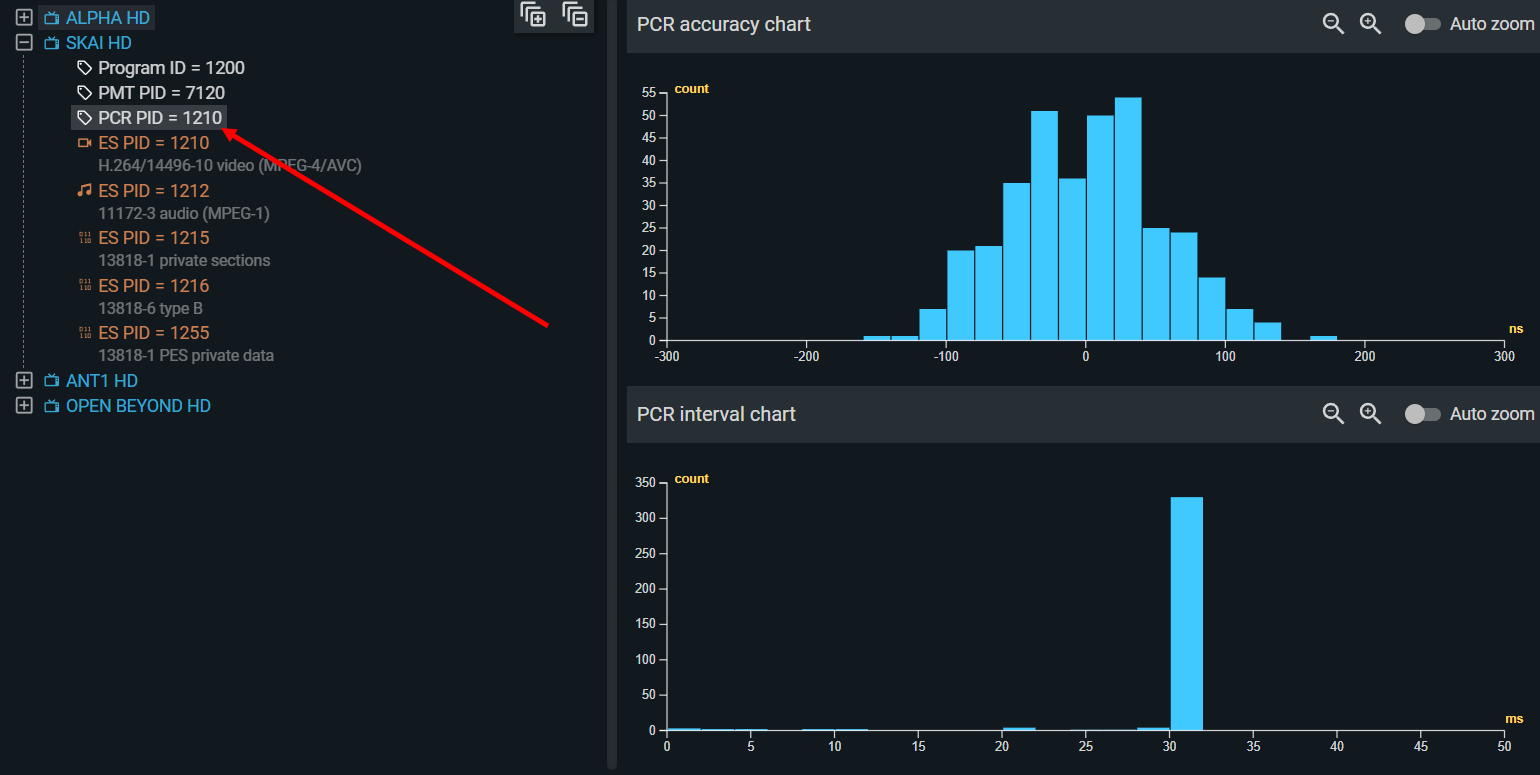
For a correctly operating CBR service, the PCR histogram should resemble a Gaussian distribution centered at zero, with deviations no greater than ±200 nanoseconds.
PCR repetition interval — separately from accuracy, PCR must arrive at least once every 100 ms. The repetition histogram shows the distribution of intervals between consecutive PCR values:
For a VBR service, the histogram will be chaotic with no clear peak. This is expected — disable the PCR_accuracy_error check in the TS Analyzer profile for VBR inputs to avoid false alarms.
Note that PCR accuracy relates to the service's overall bitrate (including stuffing for that service), not to the bitrate of individual components. A service can have variable-bitrate video and audio, yet maintain a constant overall bitrate through stuffing in the elementary stream headers — and the PCR histogram will reflect that constant bitrate.
PCR, PTS, and DTS relationships
For a correctly encoded service:
- PTS must not be ahead of PCR — data cannot be decoded before it arrives.
- DTS < PTS — data must be decoded before it is presented.
- DTS must not be ahead of PCR — for the same reason as PTS.
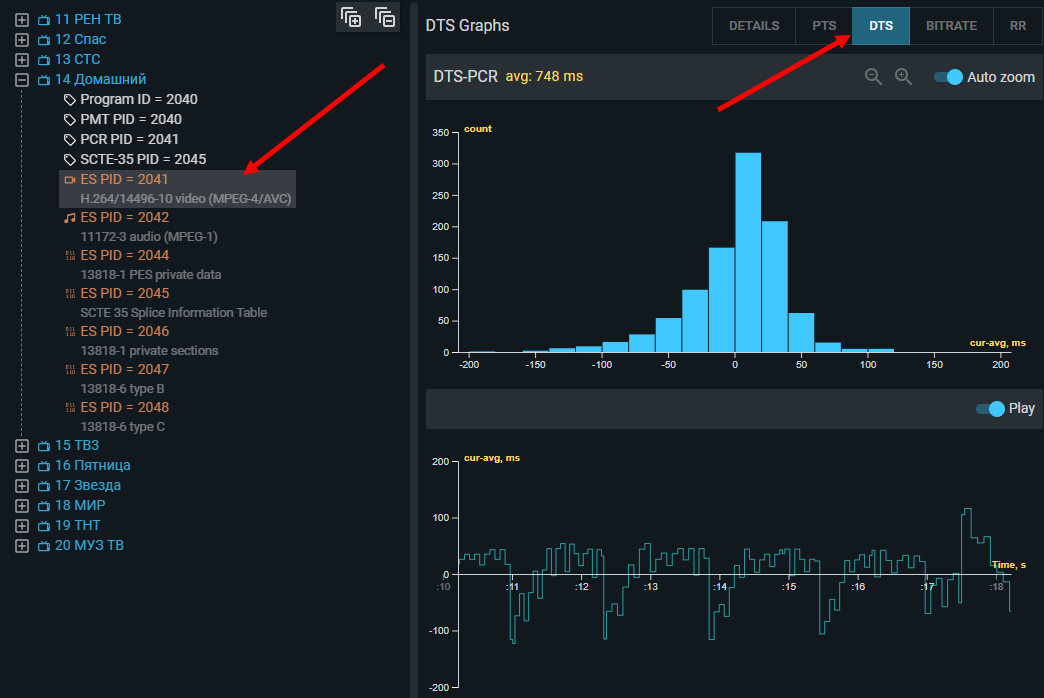
TS Analyzer compares the measured PTS (and DTS where present) against the expected value calculated from the PCR, and displays the deviation as a histogram and timeline graph. The zero on this graph represents the average offset (shown in the panel title); individual deviations are shown relative to that average.
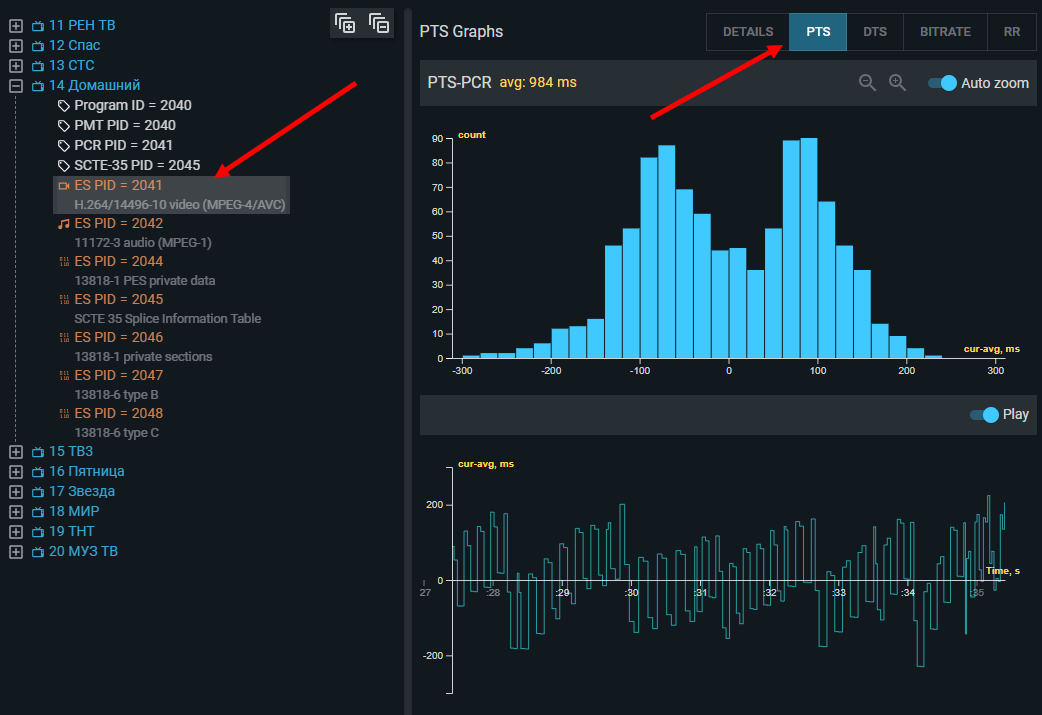
The diagram below illustrates the timing relationships and what the deviation values represent in the graphs:
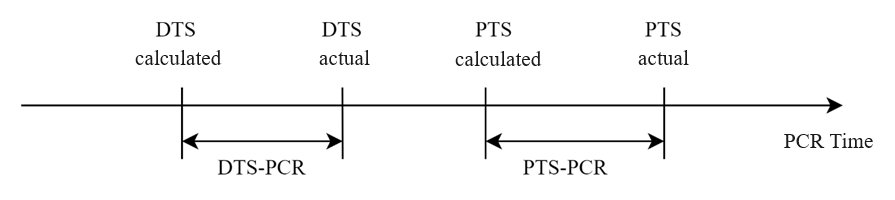
A well-behaved encoder produces a Gaussian distribution around the mean PTS-PCR offset. Chaotic distribution, systematic drift, or large deviations indicate problems in the encoder. A deviation of less than one second in the PTS-PCR offset is unlikely to cause practical problems.
Note
PTS inspection requires the service to be unscrambled. In scrambled services, PES headers are encrypted along with the payload, so PTS values cannot be read.